Do you want to know how many NYC bridges are in “poor” condition or how long it takes the FDNY to respond to fires?
Those answers and more are in this year’s edition of the Mayor’s Management Report, the charter-mandated bureaucratic bonanza of a document released Monday, acting as a sort of report card for city agencies over the last fiscal year. More broadly, it sheds light on the state of New York City.
Many of the statistics and explanations in the 450-page document make the Mayor Bill de Blasio’s administration look good. The state of the city is strong! There’s even a metric indicating that the streets are clean.
Because it’s a document released by City Hall, the mayor has a chance to explain what he’s doing to deal with less positive numbers. Regarding those bridges, for example, 0.3 percent were rated “poor,” meaning not that the bridge is unsafe but that “there are structural components of the bridge that must be addressed to avert failure or potentially imminent failure,” according to the report. The Harlem River Drive ramp to the George Washington Bridge was one of those “poor” structures, but the report notes that a capital project there is underway.
Much of the report is made up of relatively neutral and sometimes fascinating numbers. There are some 1,700,000 library card holders in the Brooklyn system. Just over 9 percent of CUNY courses are offered partly or totally online. City agencies also have to report how long it takes to respond to emails, and sometimes those numbers are low — at the FDNY, 38 percent are answered within 14 days, but luckily they’re really graded on responses to more pressing issues. The department got to structural fires in an average of 4 minutes and 58 seconds, by the way, an uptick of a few seconds from the year before.
Sometimes the numbers touch on controversial issues. By the end of the fiscal year, including past years, 9,889 NYPD officers had received Crisis Intervention Training, which teaches officers how to interact with mentally unstable individuals in tense situations. Advocates have called for more of the training for years, given one after another high-profile recent example of officers using their weapons against unstable New Yorkers. But clearly the training has not been widespread. As of the end of August, there are 36,429 uniformed members in the NYPD.
The report sometimes catches trends, as this year when the numbers showed a significant slowing of the rise in unintentional drug overdose death rates. There was a two percent increase in overdoses from calendar year 2016 to 2017, much smaller than the increase of 51 percent between the years prior. Still, “unintentional drug overdose deaths remain at epidemic levels in New York City,” the report notes.
The section on the Taxi and Limousine Commission captures the great rise of Uber, Lyft and similar vehicle-hailing services on city streets. While the number of medallion taxis stayed constant at 13,587 for five fiscal years, for-hire vehicles (which include Uber, Lyft and the like) increased from 51,145 in 2014 to 113,222 last fiscal year.
Beyond all that, the collection of numbers and analysis paints a picture of the ebb and flow of city initiatives, of how we live, and how our city looks.
It charts the number of trees planted — 34,779, 30 percent fewer than the previous fiscal year after the completion of a big MillionTreesNYC initiative.
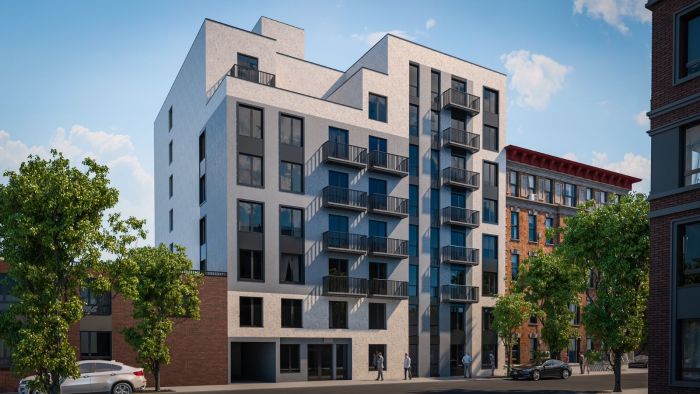
It puts numbers to the everpresent struggle with increased rents and homelessness: 32,100 affordable homes were financed in the last fiscal year. And the average number of families with children in shelter per day was 12,619.
It even gives a peak at the city’s vacant lots, those windswept, missing-tooth abnormalities that dot the cityscape in every borough. Apparently, the city monitors them. And in the last fiscal year, 3,494 lots were cleaned.
