By Candida L. Figueroa
New Yorkers and tourists alike have finally found some rhyme and reason to the economic meltdown.
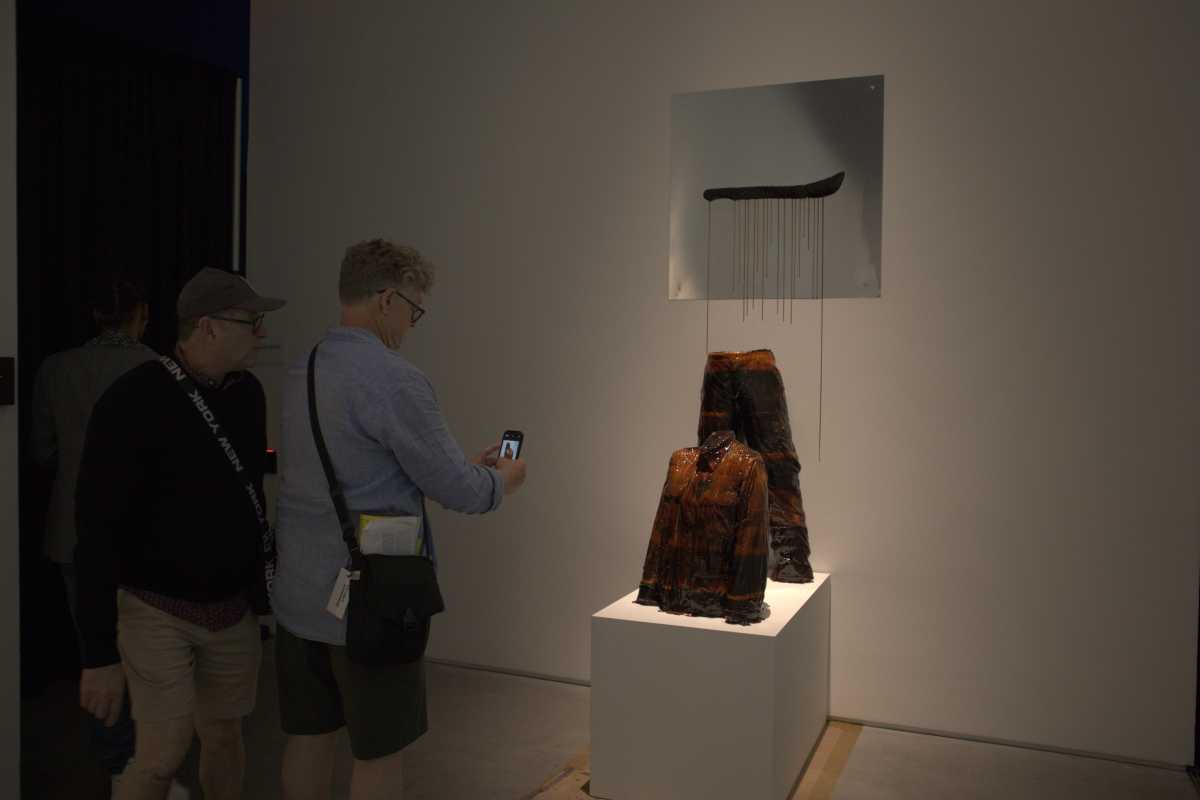
“Finance usually gives me headache,” said Ken Hirsh, 45, a construction worker from Soho. “I’m far from being a money market person, so I needed help in understanding the collapse from the beginning to now.” Hirsh was visiting the Museum of American Finance’s new exhibit, “Tracking the Credit Crisis,” which traces the recession over the last year.
Not even a month old, the exhibit has attracted the museum’s largest attendance, 500 visitors. High school and college tour groups thoroughly scan historical documents through the glass, play with interactive touch screens and watch videos of the chaotic stock market. “We are trying to make a potentially difficult and boring subject, interesting, interactive and intriguing, which is not an easy thing to do,” said museum spokesperson Kristen Aguilera. “Many people are intimidated and we want to engage a multi-generational audience on an innately complex idea.”
The 8’ x 20’ timeline follows the decline of the stock market starting from the housing crisis in Feb. 2008 to the $60 billion A.I.G. loss early last month. The exhibit co-curator Leena Akhtar plans to keep extending the timeline for the next year and a half.
The exhibit was a direct response to an overwhelming demand from museum visitors for an easy to understand explanation of the state of the economy. When the financial crisis became the main issue of the presidential race in the fall of 2008 and attendance spiked 44 percent, museum C.E.O. Lee Kjelleren and Akhtar began to construct the timeline with intentions of reaching the public in a new way.
“Trying to understand economics without having a background in it is like trying to do calculus without algebra, so we’re trying to break it down,” Akhtar said.
Dory Morrison, 22, a frequent visitor of the museum, said “That’s when I started wanting to know what exactly was going on. Breaking down the economic crisis is no easy feat, but it’s important because we are all affected by it.”
The visually attractive timeline documents major national and international financial events. All financial terms are defined in a vocabulary box, along with a description of major bank conversions and collapses. The hard to miss bold black zigzag that descends across the timeline represents the Dow Jones index, which lost half of its money within one year.
A year ago, the museum opened a new location at 48 Wall St., a move from it’s small gallery space at 26 Broadway. With a $1 million grant from the Lower Manhattan Development Corp., the museum was able to reconstruct the space and develop exhibits from scratch.
The museum has held a long tradition to visitors of rubbing the horn on a small bronze bull statue for good luck. In noticing how faded the horn is now, one visitor carrying a JP Morgan backpack mumbled, “We need all the good luck we can get these days so I’ll be rubbing this for a long time.”


