

What is over 40 years old, 420-odd pages long, and paints a picture by numbers of how New York City is doing?
It’s the Mayor’s Management Report.
Produced by the Mayor’s Office of Operations, this document is a much-worshipped item for data fiends and anyone with an interest in charting the ebbs and flows of the metropolis over the last fiscal year, which ended in June.
We pulled out some of the highlights — this year’s edition was released last week — for you here:
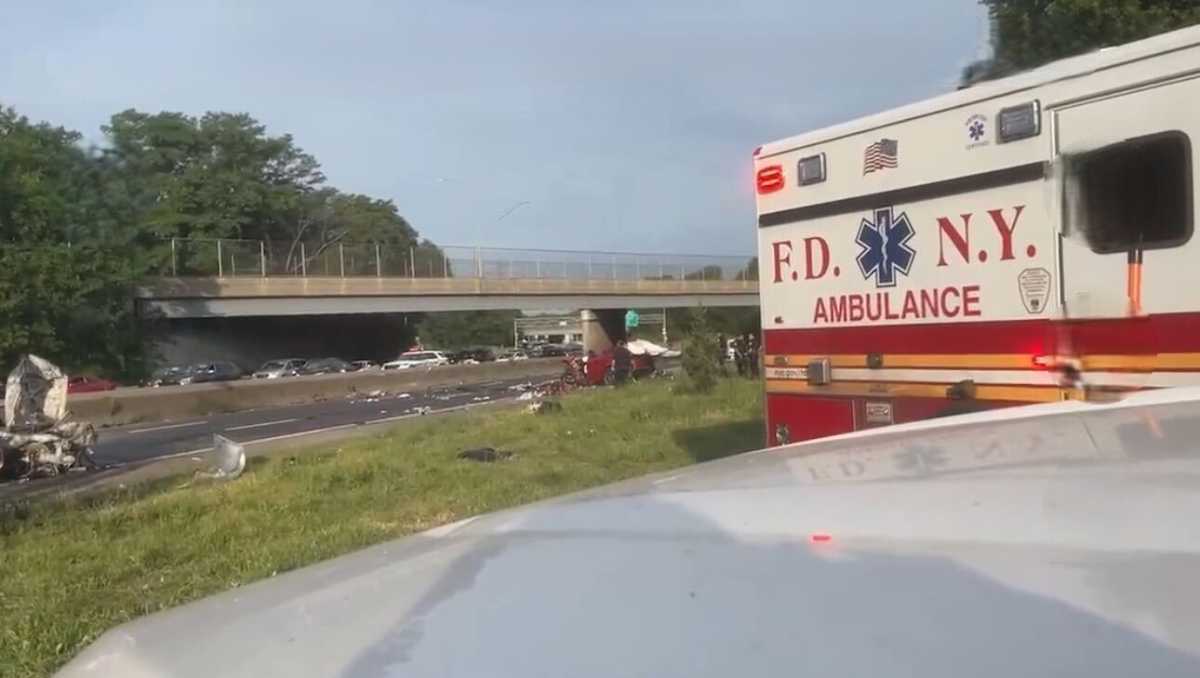
Emergency response
FDNY and ambulance average response times climbed across the board, even though the total number of fire deaths are down. It took an extra 8 seconds on average for response time to structural fires (now up to 4 minutes, 28 seconds), and an added 28 seconds in average response to life-threatening medical emergencies by ambulances (up to 7 minutes, 23 seconds). Both of those include FDNY dispatch and travel time only.
The slowdown may be due to a drop in EMS headcount, plus more crowded roads. The report says “Travel time increases may be partly attributed to continued population growth, with more vehicles on the road and more construction.” Elsewhere, the MMR logs that we now have 120,954 for-hire vehicles.
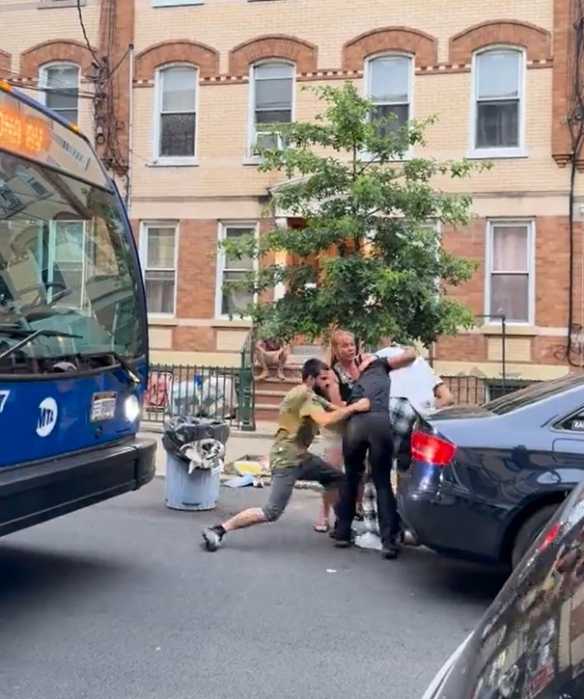
Policing shifts
In fiscal year 2019, 128,265 quality-of-life summonses were issued, which is approximately 40 percent of the total four years earlier, representing a big decline.
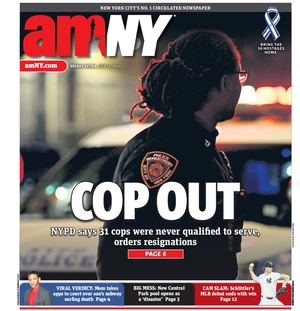
But sometimes what’s missing from this key report is as revealing as what’s included. The MMR has previously included the number of NYPD officers who received crisis-intervention training, which can help when responding to emotionally disturbed individuals. But progress in that area has been slow. The figure dropped out of the MMR this year. When asked, an NYPD spokesman said 15,000 officers had received the specialized training as of last week, some 40 percent of the force.
When queried about the missing figure, a spokesman for the Mayor’s Office of ThriveNYC said the report is “intended to provide a snapshot of our work, rather than a complete review.”
Homelessness
The numbers on NYC’s homeless population are still high, with small reductions posted in the number of adult families and families with children entering the shelter system.
One eye-opening stat that the city has tried to combat: Just 52.9 percent of families were initially placed in shelters in the borough of their youngest school-aged child’s school address, a small increase over last fiscal year.
The little things
Some of the numbers are extremely specific, such as the percentage of emails responded to by city agencies in 14 days. The FDNY and Department of Housing Preservation and Development are among the lowest.
Other stats are little indicators about which entire theses might be written. Circulation, for example, is down at city libraries, which library staff notes is part of a national trend, and some key branches have been closed.
And just 55 percent of Parks Department monuments are marked as receiving their annual maintenance.
“Thanks to the work of our Citywide Monuments Conservation Program, most of our monuments are in good condition and therefore don’t necessarily require annual maintenance,” says a parks spokeswoman, noting other more needy works that received greater attention.
Quick bonuses
More than 42 million inquiries were received by 311 over the fiscal year.
Average daily attendance at senior centers, a number that’s up over the years, is 29,726.
And lots of potholes got repaired: 228,339 of them. Seriously.