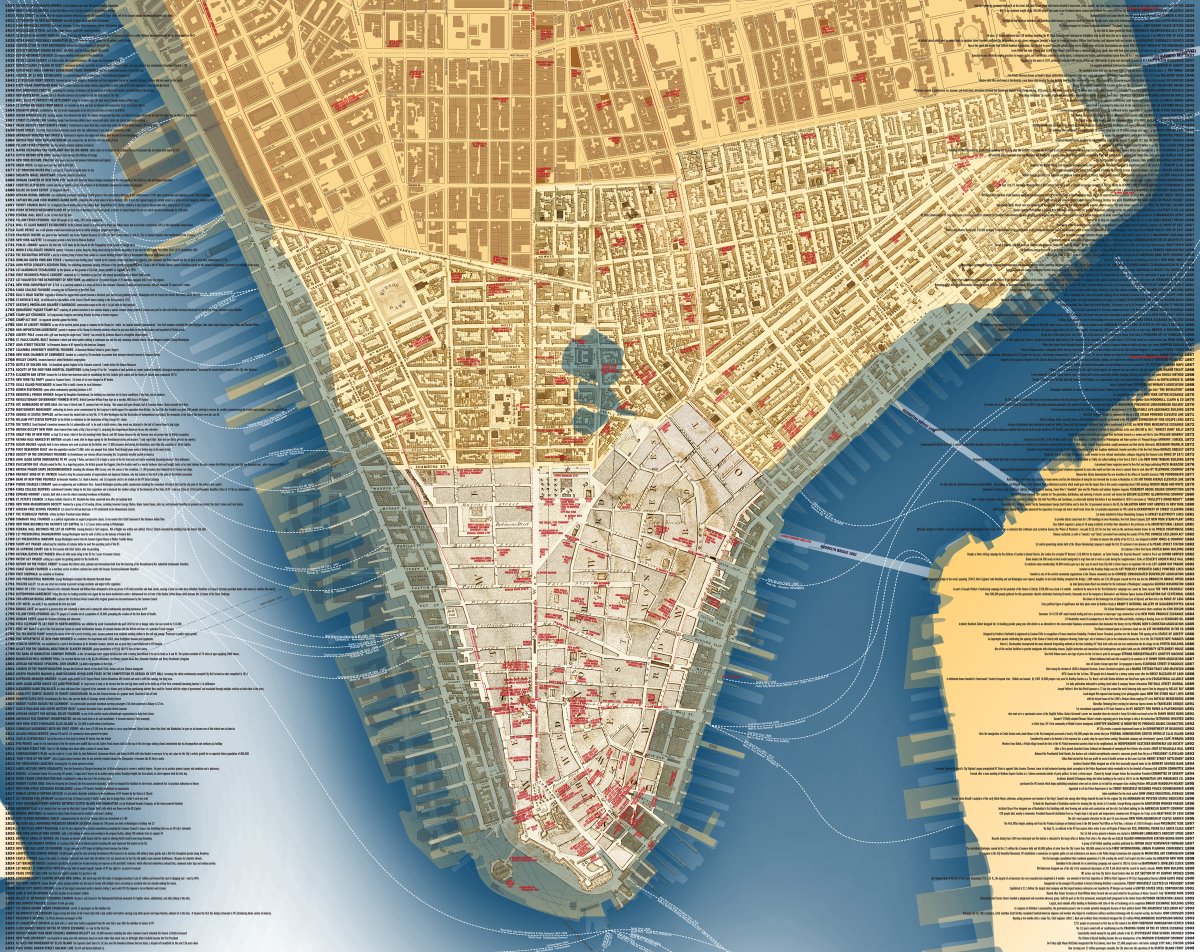
The front side of cultureNOW’s map, “Lower Manhattan Then,” layers nine historical maps and aerial views to show how Downtown has evolved through more than three centuries, and lists about 400 historical events from 1524 through 1905.
BY DENNIS LYNCH
No place in city has more history than Lower Manhattan and now one local cultural organization has packed four centuries of it into a pair of maps that tell the story of New York’s First Neighborhood.
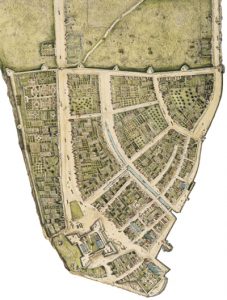
The 1660 Castello Plan for New Amsterdam — at that time just the tip of Manhattan south of Wall Streets eponymous barrier — was the city’s first planning map. Originally drawn up by Jacques Cortelyou, this is a version redrawn in 1916 by John Wolcott Adams and Isaac Newton Phelps Stokes.
CultureNOW’s maps include more than 800 significant Downtown events — from Italian explorer Giovanni de Verrazzano’s 1524 landing at the tip of The Battery, to the opening of the $4 billion Oculus transit hub. “Lower Manhattan Then” charts everything up to about the turn of the 20th century, and on the reverse side, “Lower Manhattan Now” covers everything after 1905.
Researchers at cultureNOW spent hundreds of hours digging through historical records to pick out significant events of all kinds, said the president and a founding member of the group.
“I’m pretty sure we didn’t get everything,” Abby Suckle said. “We put what we thought was impactful — if we thought that the event had some sort of significance, be it an invention, something cultural, or something we thought was interesting.”
Suckle built the maps with a team of Harvard University students over the summer, asking them “how do you tell this story [of time and change] in a document?”
The map set features the tip of Manhattan south of Houston St., with the historical events listed down the right and left sides.
“What we were trying to do when we started the project was to see if we could kind of capture the whole flavor of the neighborhood over time, so the research part of it became ‘what happened, and then how do you organize it?’” she said.
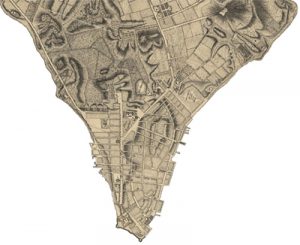
This map drawn by John Montresor shows the state of the city, now called New York, at the time of our country’s founding, in 1776.
They started with historical city maps from the last 350 years and layered them together for “Lower Manhattan Then” — a composite of nine cartographs beginning with the earliest known map of the Dutch New Amsterdam colony, circa 1660. The map reveals how the area’s history has influenced its modern character.
Broadway, for example, got its start as a Wickquasgeck Native American trail that 17th-century Dutch colonists expanded into a road in and out of their settlement at the southern end of Manhattan Island.
Wall St. got its name from — you guessed it — a defensive wall the Dutch built at the northern edge of that colony in 1653. About 140 years later, colonists founded the New York Stock Exchange under a buttonwood tree there near Hanover Square, just a few grim steps from their slave-trading market, cementing Wall St. as the hub of the American financial system.
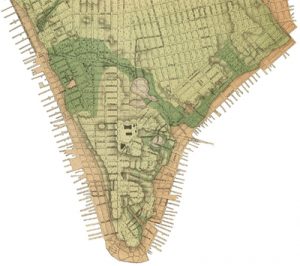
This 1874 topographical map shows the physical features of Downtown’s terrain.
Further north, an 18th-century map gives way to an 1852 map by John F. Harrison that shows the early plan of a densely packed Lower East Side, Tribeca, Chinatown, and Little Italy. We see the first tenement house built in the city on Mott St. between Bayard and Walker Sts. in 1824, and the 1862 chartering of the Grand Street Ferry Railroad that ran from — you guessed it again! — a ferry on the East River at the end of Grand Street.
The modern geographic information system map fills the rest of the map above Canal and Delancey Street. Along the shore, the nine maps layered on top of each other show the gradual growth of the island outward from its original shoreline as officials flattened the island and dumped the earth into the river. An 1874 topographical map on the side shows the hills and ridges, scraped down for landfill.
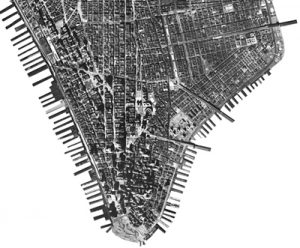
This aerial view shows that as recently as 1951, Downtown still bristled with the piers that originally established Lower Manhattan as the economic epicenter of America.
On the other side of the glossy, 27×36-inch foldout, “Lower Manhattan Now” depicts the steady growth of the Financial District up into the Manhattan skyline, the creation of Battery Park City, and the development of neighborhoods north of Chambers Street as we know them now.
The “Lower Manhattan Now” side is much more detailed, with street names and markers for museums, art sculptures, and subways stations, so it’s definitely a better reference for the pavement-pounding history buff. But it also includes its share of historical curiosities, such as lines tracing the routes of the pneumatic tube system that whisked mail around the city from 1897 to 1953.
The map also depicts the storm surge of Hurricane Sandy in 2012, and marks the 2050 flood zone projected by National Oceanic and Atmospheric Administration, which reaches all the way to Church Street in the east and engulfs most of the Financial District.
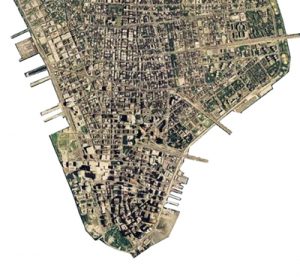
This 1996 aerial view shows Lower Manhattan after it lost most of its piers, but gained Battery Park City.
Some of the history the maps cover is clearly visible on the streets of Lower Manhattan today, such at Trinity Church’s storied cemetery. But as Suckle and her team looked over the history of the Downtown area, they started to see that a lot happened in Lower Manhattan that fell through the historical cracks. Revolutionary War history is highly celebrated, for example, but the story of the evolution of prisons in the area isn’t, she said.
“Similarly, with disasters, you see 9/11, you see Sandy,” she said, “but you skip the part where they had a horse poop problem 100 years ago.”
“Lower Manhattan Then & Now” is the latest in a series of Lower Manhattan maps the group has put together over the last 15 years. CultureNOW has its roots with Suckle and a group of architects, historians, scholars, and artists that started getting together in 2001 following the 9/11 attacks. They wanted to encourage people to come back to the area and figured that maps highlighting history and other attractions in the neighborhoods could do that.
They distributed half a million cultural and historical maps of Lower Manhattan across five editions between 2002 and 2006, and maps of culture and art around other parts of the island since then. They’ve also partnered with cities around the country for their MuseumWithoutWalls project, which Suckle says “showcases their cultural assets in a new way,” through podcasts and content available through their smartphone app and website.
The “Lower Manhattan Then & Now” maps are $10 and available through cultureNOW’s website.
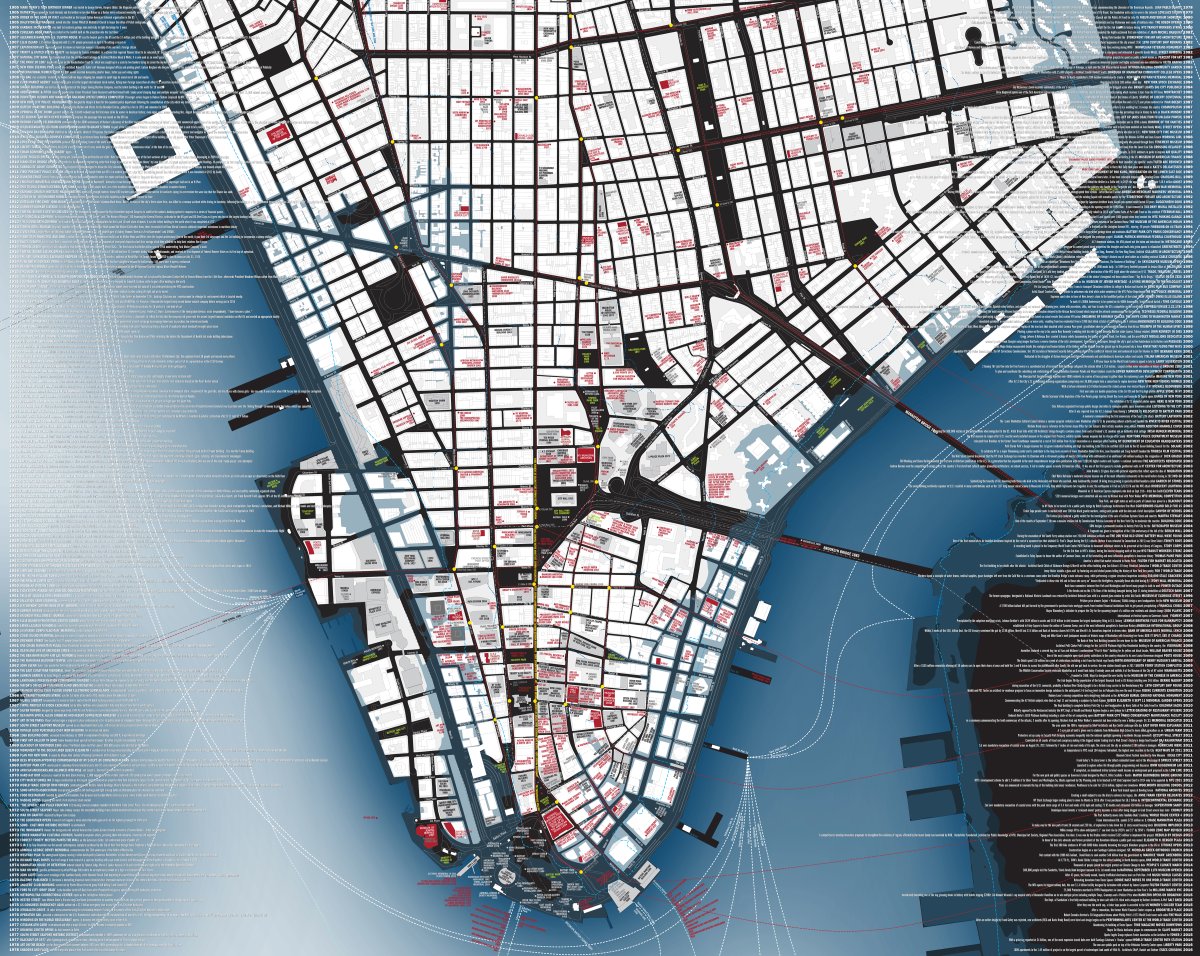
The reverse side of the map, “Lower Manhattan Now,” is a more conventional-looking rendering of Lower Manhattan that labels notable buildings and the sites of significant events, as well as showing the extent of Hurricane Sandy’s storm surge in 2012 and the projected flood plain in 2050. The margins list historic Downtown events from 1906 through 2016.
