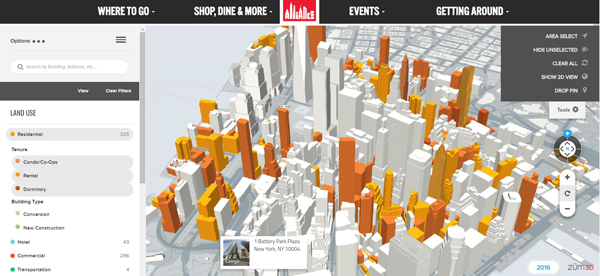
The Alliance’s LM3D interactive map lets you view, for example, residential buildings differentiated between condos and rentals.
BY DENNIS LYNCH
The Downtown Alliance has unveiled the beta version of it’s three-dimensional, interactive, online map of Lower Manhattan. The aptly named LM3D project visualizes reams of neighborhood data all in one place to make it easier to digest for Downtown residents, business owners, or anyone interested in the neighborhood.
Alliance president Jessica Lappin said it’s often difficult to paint the big picture of change in Lower Manhattan with all that’s been happening in the area over the last few years — but “a map is worth a thousand words.”
“We’ve been collecting this information, and we’ve put it out in our quarterly reports, but it can be hard to synthesize it,” Lappin said. “When you see it all together in one place it can be more useful, and so it gives people in real estate, or a planner, or a property owner, a new tool to take a look in a bird’s-eye view manner of what’s happening in the neighborhood.”
LM3D gives the user a few ways of interacting with the data. For information on an individual building, you can either click on a building on the 3-D map, or search an address to get an overview of the place.
Take Frank Ghery’s 8 Spruce Street for example — clicking on the tower brings up a readout of the total square footage of the tower and how it’s broken down between residential and retail space. In this case you see there’s 773,169 square-feet of residential space spread between 899 units. You also get information about Birch Coffee on the ground floor and PS 397, including phone numbers and websites.
That option is useful if you want to find out what’s around a certain building or area, which the Alliance often gets calls for help with, Lappin said.
“We field calls from people all the time asking for this information — even though it’s already sort of out there on the web,” Lappin said. “Often we’ll get a broker who has a tenant moving in and wants to understand the context of an area better. It’s for sure a great tool for them.”
But it’s the filters on the left-side menu that really showcases what the platform can do, whether you’re browsing out of curiosity or actually hoping to glean some useful information about the neighborhood.
The Alliance has organized its data into submenus — such as “Land Use” for a color coded breakdown of neighborhood-wide properties, “Development Pipeline” to show projects in the works, and “Property Owner” for finding all of the properties owned by any landowner in the neighborhood.
Some of those breakdown further. For example, the Land Use menu lets you differentiate between new construction and conversions, or between condos, rentals, and dorms.
The Alliance has also has an option to view the makeup of Lower Manhattan’s main “corridors” — Broadway, Fulton Street, Water Street, and the World Trade Center area. Among other options, you can map all the subway entrances, which will definitely be useful for prospective residents and visitors, surface parking options, and all the vacant space on the neighborhood. (We’ll save you the trouble of clicking on it — the only empty lot is one at 115 Nassau Street.)
Lappin said the platform has a lot of options because it’s meant to be useful for a lot of different kinds of interested parties.
“People will use it in different ways. If you’re a retailer, you might look at where residential and commercial spaces are popping up. If you’re a restaurateur opening a restaurant, you might be interested in what’s happening around your location,” Lappin said.
The Alliance still needs to work out some of LM3D’s kinks though, which you can expect with the beta version of any program. The Alliance could use more-contrasting colors to better differentiate the kinds of property in some cases. The colors used to show the different types of residential buildings (condos/co-ops, rentals, and dorms) are very similar, as are the colors used to show new construction and conversions.
You’ll need a fairly fast computer to run LM3D smoothly. It was somewhat sluggish on a laptop that’s a few years old with a decent internet connection. There is a two-dimensional option, but it doesn’t speed up LM3D very much. It would be more accessible to locals without a newer computer if there was a more bare bones two-dimensional option.
The Alliance will release the full version of LM3D this fall, and plans to update the system data regularly, either a few times a week or once a week, depending on market activity and when the city releases that information publicly.
The biggest feature coming to the final version will be historical data going back to the late 1990s, an Alliance spokesperson said. That data, he said, will take the longest time to incorporate into the platform.
Check it out online at: lm3d.downtownny.com.
